

A PC that suddenly slows down, gets unusually loud, freezes, or shuts itself off may be struggling with heat. Checking the processor temperature is one of the quickest ways to find out.
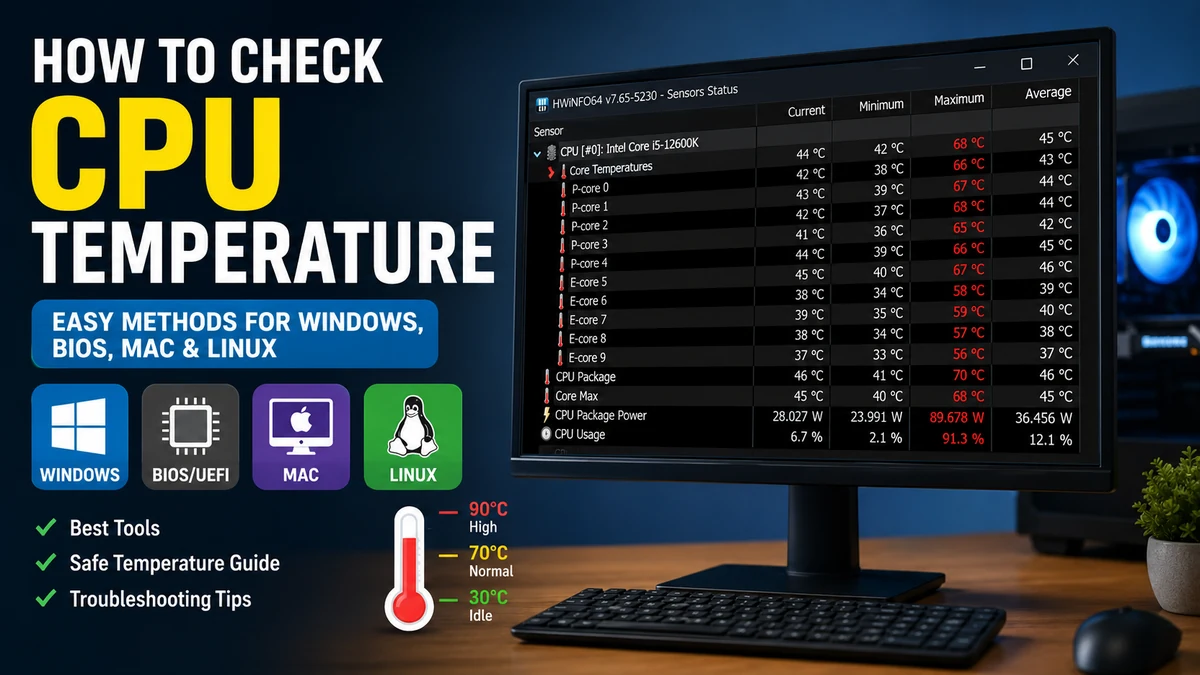
If you want to know how to check cpu temperature, the easiest method on Windows is to use a hardware-monitoring utility such as HWiNFO, Core Temp, or HWMonitor. These programs read the CPU’s built-in thermal sensors and display current, minimum, and maximum temperatures. You can also check a baseline temperature through your computer’s BIOS or UEFI.
The important part isn’t simply finding a temperature reading. You also need to understand which reading matters, when it was recorded, and whether it is normal for your particular processor and workload.
How to check cpu temperature on Windows 11 and Windows 10
Windows makes monitoring CPU usage easy, but CPU temperature is different. Windows 11 and Windows 10 generally don’t provide a standard built-in CPU temperature reading in Task Manager. Current guides therefore continue to recommend sensor-monitoring software for live CPU temperatures.
That distinction matters because Task Manager may display a GPU temperature on supported hardware, which can easily be mistaken for the processor temperature.
For most people, the simplest approach is:
- Install a reputable hardware-monitoring application.
- Open its sensor or temperature view.
- Find your processor.
- Check the current CPU or core temperature.
- Leave the program running while performing your normal workload.
- Look at the maximum temperature afterward.
Checking the maximum temperature is particularly useful. A CPU could be sitting comfortably at 40°C when you open the monitoring application but reach 90°C during gaming, rendering, compiling, or another demanding task.
Using HWiNFO
HWiNFO is one of the most useful choices when you want detailed information rather than a single temperature number.
After launching HWiNFO:
- Select Sensors-only if prompted.
- Find the section containing your processor model.
- Look for entries such as CPU Package, Core Temperatures, CPU Die, or similar temperature sensors.
- Check the Current, Minimum, Maximum, and Average columns.
- Run the application or game you want to test.
- Return to HWiNFO and examine the maximum reading.
HWiNFO is particularly useful for troubleshooting because it can display far more than temperature. Depending on the hardware, you’ll also find clock speeds, voltages, power consumption, fan data, and indicators related to thermal or power limits.
This helps answer the more useful question: Is temperature actually causing the performance problem?
Using Core Temp
Core Temp is a simpler alternative when you primarily care about processor temperatures.
Open the application and look at the temperature readings for the individual CPU cores. You can monitor them while the computer is idle and then again during a demanding workload.
Core Temp can also show minimum and maximum readings, making it easy to identify brief temperature spikes that you might otherwise miss. Both Tom’s Hardware and PCWorld recommend it as a straightforward way to monitor processor temperatures.
When installing free utilities, read the installer screens rather than clicking through automatically. Some installers may present optional bundled software.
Using HWMonitor
Another established option is HWMonitor by CPUID.
HWMonitor is useful when you want one window containing information about multiple components.
Expand the section containing your processor and find its temperature readings. Depending on the system, you’ll normally see values such as:
| Reading | What it tells you |
|---|---|
| Current | CPU temperature right now |
| Minimum | Lowest recorded temperature |
| Maximum | Highest recorded temperature |
| Package | Temperature associated with the overall CPU package |
| Core | Temperature reported for an individual processor core |
For diagnosing overheating, the maximum reading under a realistic workload is usually more informative than staring at the current number while the computer is doing nothing.
How to check cpu temperature without software
If you don’t want to install an application, you can usually check the CPU temperature through your motherboard’s BIOS or UEFI firmware.
This method works independently of Windows and is useful for establishing a basic temperature reading.
Check CPU temperature in BIOS or UEFI
Restart the computer and enter the firmware interface.
Common keys include:
- Delete
- F2
- F10
- F12
- Esc
The exact key depends on the PC or motherboard manufacturer.
Windows 11 systems can also provide access through the recovery environment. Depending on the computer, you can navigate through the advanced startup options to Troubleshoot > Advanced options > UEFI Firmware Settings, then restart into the firmware interface.
Once inside, look for a section called:
- Hardware Monitor
- H/W Monitor
- PC Health
- System Health
- Hardware Status
- Monitor
You should see an entry similar to CPU Temperature.
Why BIOS temperature isn’t enough
There’s an important limitation.
Your processor isn’t running your normal Windows applications while you’re sitting inside the BIOS. As a result, a BIOS temperature is primarily a baseline reading, not a reliable measurement of what happens while gaming or performing heavy work.
Imagine this situation:
- BIOS temperature: 42°C
- Windows idle: 45°C
- Gaming temperature: 82°C
- Rendering temperature: 94°C
Looking only at the BIOS value would make the computer appear perfectly cool.
Quick Takeaway: Use BIOS/UEFI when you need a quick temperature check without installing software. Use HWiNFO, Core Temp, or HWMonitor when diagnosing temperatures under real workloads.
What is a normal CPU temperature?
There isn’t one universal “normal CPU temperature.”
Temperature depends on the processor architecture, cooling system, ambient room temperature, workload, power limits, laptop or desktop design, and manufacturer specifications.
As a practical general reference:
| CPU condition | Approximate temperature | General interpretation |
|---|---|---|
| Idle/light activity | 30–50°C | Common |
| Everyday/moderate work | 40–70°C | Usually normal |
| Gaming/heavy workload | 60–85°C | Common on many modern systems |
| Very heavy workload | 80–90°C | Worth monitoring |
| Sustained 90°C+ | 90°C+ | Investigate against CPU specifications |
| Near processor thermal limit | Model-specific | Throttling may occur |
These are guidelines rather than hard limits. Current technical guides likewise place common idle temperatures around the 30–50°C region while noting that temperatures can rise substantially during demanding workloads.
A modern high-performance laptop, for example, can run significantly hotter than a large desktop with a powerful tower cooler while both systems operate as designed.
Is 70°C hot for a CPU?
Usually, 70°C isn’t unusually hot under load.
If you’re gaming, rendering video, compiling code, or performing another CPU-intensive task, 70°C can be a perfectly reasonable result.
Seeing 70°C while the computer has been completely idle for several minutes deserves more investigation.
Is 80°C safe for a CPU?
For many modern processors, 80°C during a demanding workload is within the normal operating region.
Context matters.
A brief 80°C spike when an application launches is different from sitting continuously at 80°C while browsing a simple webpage.
Instead of treating 80°C as a universal danger threshold, compare your results with the thermal specifications for your exact processor.
Is 90°C too hot?
A CPU reaching 90°C isn’t automatically damaged, particularly in thermally constrained laptops or during intensive workloads. However, sustained temperatures around or above this level deserve attention.
PCWorld recommends investigating temperatures above roughly 90°C, while TechRadar similarly treats the 80–90°C range as something to monitor and temperatures above 90°C as a reason to inspect cooling.
The manufacturer’s specification remains more authoritative than a generic internet temperature chart.
How to check cpu temperature while gaming
Checking your desktop temperature and immediately closing the monitoring application doesn’t tell you much about gaming thermals.
The better method is to measure the CPU during or immediately after a realistic workload.
For example:
- Open HWiNFO, Core Temp, or HWMonitor.
- Reset the minimum and maximum sensor values if the application supports it.
- Start your game.
- Play normally for 15–30 minutes.
- Return to the monitoring program.
- Check the maximum CPU temperature.
- Compare it with your processor’s specifications.
If your monitoring software supports an on-screen display or logging, you can watch temperatures over time instead of relying only on the peak.
Don’t judge the CPU by one short spike
Modern processors can change frequency, voltage, and power consumption extremely quickly.
Opening an application might temporarily push the processor from 45°C to 75°C before it settles back to 55°C.
A short spike isn’t the same thing as sustained overheating.
What matters more is the pattern:
temperature + workload + duration + clock behavior
A processor sitting at its thermal limit while its clock speed repeatedly drops is much more concerning than an occasional high reading that disappears immediately.
Which CPU temperature reading should you watch?
Modern monitoring applications can show an intimidating number of sensors.
You might see:
- CPU Package
- CPU Die
- CPU Core
- Core Max
- Tctl
- Tdie
- CCD
- individual core temperatures
- motherboard CPU readings
These numbers don’t necessarily represent exactly the same measurement.
CPU package vs core temperature
Individual core readings represent thermal information associated with particular processing cores.
A CPU package reading provides a broader processor-level value. Depending on the processor and monitoring application, it may be the more convenient value for general monitoring.
When troubleshooting, don’t obsess over a one- or two-degree difference between sensors. Look for the highest meaningful processor temperature and how it behaves over time.
AMD Ryzen Tctl and Tdie
AMD Ryzen systems can sometimes expose readings called Tctl and Tdie.
Tdie relates to the actual die temperature, while Tctl is a control temperature used by the cooling system and may behave differently depending on the processor. PCWorld specifically notes this distinction when interpreting Ryzen sensor readings.
Modern monitoring programs usually label these sensors clearly enough to make the relevant reading easier to identify.
How to check CPU temperature on a laptop
The basic process is the same as on a desktop.
Use a compatible monitoring utility, then compare idle and loaded temperatures.
Laptops require slightly different expectations because their processors operate inside a much smaller cooling system. Thin notebooks may also use aggressive boost behavior, causing short temperature spikes.
Test the laptop in its normal operating position:
- Put it on a hard, flat surface.
- Open the temperature monitor.
- Let the system settle for several minutes.
- Record the idle temperature.
- Perform your normal heavy workload.
- Check the maximum temperature afterward.
Avoid testing a laptop while its intake vents are buried in bedding, cushions, or another soft material. Restricting airflow can dramatically change the result.
Also check whether your laptop manufacturer provides a hardware-control application. Some gaming and performance laptops expose CPU temperature, fan profiles, power modes, and other thermal information directly through their manufacturer software.
How to check CPU temperature on macOS
macOS does not normally provide a simple CPU temperature number through the standard system interface.
Third-party system-monitoring applications are therefore commonly used when an exact temperature reading is required.
Tools such as iStat Menus and other sensor-monitoring utilities can display temperatures and fan information, depending on the Mac model.
Apple silicon systems should also be interpreted differently from traditional desktop PCs. Their thermal and power-management behavior is tightly integrated into the system, so generic Windows CPU temperature rules aren’t always meaningful.
If your goal is troubleshooting rather than collecting a specific number, watch for symptoms such as:
- unusually high fan activity on applicable models
- reduced performance under sustained workloads
- excessive chassis heat
- repeated shutdowns
- abnormal behavior during demanding applications
How to check CPU temperature on Linux
Linux users have several command-line options for monitoring hardware sensors.
A common approach is the lm-sensors package.
On Debian- or Ubuntu-based distributions, it can typically be installed with:
sudo apt install lm-sensorsThen run:
sudo sensors-detectAfter detection, display available readings with:
sensorsDepending on the CPU and kernel drivers, the output can contain individual core temperatures, package temperatures, high-temperature thresholds, and other hardware sensor data.
Linux also exposes some hardware-monitoring information through sysfs, although the sensor names and available readings vary between machines.
Why is my CPU temperature so high?
Finding a high reading is only the first part of troubleshooting.
Heat has to travel from the CPU through its integrated heat spreader, into the cooler, and finally into the surrounding air. Anything that interferes with that path can increase temperatures.
Common causes include:
- Dust blocking heatsinks or vents
- CPU fan failure
- Pump failure in a liquid cooler
- Poor case airflow
- Incorrect cooler installation
- Old or poorly applied thermal paste
- Excessive CPU voltage
- Aggressive motherboard power settings
- Overclocking
- High ambient room temperature
- Background processes consuming CPU resources
- Blocked laptop ventilation
One overlooked problem on newly assembled desktops is the protective plastic film on some cooler contact plates. If it isn’t removed before installation, heat transfer can be severely impaired. Windows Central specifically highlights this installation mistake when troubleshooting unusually high temperatures.
Check CPU usage first
Before taking the computer apart, open Task Manager and examine CPU utilization.
If a background process is constantly using a large percentage of the processor, the high temperature may simply reflect a high workload.
That means the cooling system may not actually be the root cause.
Close or investigate the problematic process and watch what happens to the temperature.
Inspect airflow and dust
Turn the computer off before physically inspecting it.
Check:
- CPU heatsink
- intake vents
- exhaust vents
- case filters
- CPU cooler fan
- case fans
- laptop ventilation openings
Dust can insulate heatsink fins and restrict airflow. PCWorld identifies cleaning fans and ventilation as one of the first practical steps when temperatures become excessive.
Check the CPU cooler
On a desktop, make sure the heatsink is firmly and evenly mounted.
If you’re using an all-in-one liquid cooler, confirm that its pump and radiator fans are functioning.
A temperature that rockets toward the thermal limit almost immediately after starting a demanding workload can indicate poor cooler contact, a failed pump, or another cooling problem.
Consider the thermal paste
Thermal interface material fills microscopic gaps between the processor’s heat spreader and cooler.
Replacing thermal paste can help if the existing application has deteriorated, the cooler was removed, or mounting/contact is poor.
But don’t automatically replace thermal paste every time you see a high number. Check workload, airflow, fan operation, room temperature, and cooler installation first.
What is thermal throttling?
Modern processors contain temperature sensors and protective mechanisms.
When operating conditions reach predefined limits, the CPU can reduce frequency, voltage, or power to control heat. This behavior is generally known as thermal throttling.
You might notice:
- sudden FPS drops
- slower rendering
- inconsistent benchmark results
- reduced CPU clock speeds
- loud cooling fans
- performance recovering after the system cools
Thermal throttling is protective behavior, but repeatedly hitting thermal limits can indicate that the cooling system isn’t keeping up with the processor.
Unexpected shutdowns can also occur when thermal conditions become severe, although shutdowns can have many other causes.
CPU temperature vs GPU temperature
CPU and GPU temperatures are separate measurements.
The CPU handles general-purpose processing, while the GPU performs graphics and highly parallel workloads. Gaming can place substantial load on both simultaneously.
This creates an important troubleshooting trap.
Your CPU could be:
- 72°C
while your graphics processor is:
- 86°C
Seeing the GPU temperature doesn’t tell you how hot the CPU is.
This is particularly relevant in Windows because Task Manager may expose GPU temperature on compatible systems even though it doesn’t provide the same general-purpose native CPU temperature monitor.
Applications such as HWiNFO and HWMonitor make the distinction clearer by showing both component groups separately.
How often should you check CPU temperature?
You don’t need to watch CPU temperature constantly on a healthy computer.
Checking it is particularly useful when:
- building a new PC
- installing a new CPU cooler
- changing thermal paste
- overclocking or undervolting
- changing BIOS power settings
- experiencing unexpected shutdowns
- noticing unexplained performance drops
- hearing fans constantly running at high speed
- troubleshooting gaming stutters
- buying or testing a used computer
Tom’s Hardware recommends periodically checking temperatures and checking again when performance problems appear.
For a newly built desktop, checking idle and sustained-load temperatures early is especially useful because it establishes a baseline.
Common CPU temperature monitoring mistakes
Temperature monitoring sounds straightforward, but a few mistakes can make perfectly normal hardware look problematic.
Comparing different workloads
A 45°C idle temperature can’t meaningfully be compared with someone else’s 75°C gaming temperature.
Always compare similar conditions.
Comparing different processors
Different generations and models from Intel and AMD have different power characteristics and thermal limits.
A temperature considered typical for one processor isn’t automatically the ideal target for another.
Ignoring room temperature
A computer sitting in a 32°C room naturally has less thermal headroom than the same machine operating in a 20°C room.
Ambient temperature affects every air- or liquid-cooled PC.
Looking only at idle temperature
A system can look completely healthy at idle and overheat under sustained load.
That’s why monitoring software is generally more useful than a BIOS-only reading for diagnosing real-world thermal behavior.
Treating every spike as overheating
Brief temperature jumps are normal on modern CPUs.
Focus on sustained temperatures and resulting behavior.
Using generic temperature limits
The safest approach is to identify your exact CPU model and consult its manufacturer’s thermal specifications.
Generic charts are useful for orientation, not as substitutes for processor-specific limits.
A practical CPU temperature test
If you suspect overheating, use a repeatable process rather than randomly checking numbers.
Start by letting the computer sit at the desktop for several minutes. Record the idle temperature.
Next, open your monitoring program and reset its maximum values if possible.
Run the workload that normally causes problems—your game, video editor, development environment, rendering software, or other demanding application.
Continue long enough for the cooling system to reach a reasonably stable state.
Then record:
| Metric | What to record |
|---|---|
| Idle temperature | Temperature after several quiet minutes |
| Loaded temperature | Typical temperature during workload |
| Maximum temperature | Highest recorded value |
| CPU usage | Approximate processor utilization |
| Clock speed | Whether frequency remains stable |
| Fan behavior | Normal, loud, or unusually slow |
| Symptoms | Stutter, crash, shutdown, or none |
This gives you far more useful diagnostic information than saying, “My CPU hit 85°C once.”
What to do after you check the CPU temperature
If the temperature is normal and the computer is stable, you usually don’t need to do anything.
If temperatures seem excessive:
- Verify the reading with a reputable monitoring tool.
- Compare it with the specification for your exact CPU.
- Check CPU utilization for unexpected workloads.
- Clean obstructed vents, filters, fans, and heatsinks.
- Confirm the CPU cooler and fans are operating correctly.
- Check cooler mounting if the problem started after hardware work.
- Inspect thermal paste when cooler contact is questionable.
- Review overclocking, voltage, and motherboard power settings.
- Improve case airflow if necessary.
- Retest under the same workload.
Change one thing at a time whenever possible. Otherwise, you won’t know which adjustment actually solved the problem.
Final thoughts on how to check cpu temperature
Learning how to check cpu temperature takes only a few minutes, but interpreting the reading correctly is more important than the number itself.
On Windows, HWiNFO, Core Temp, and HWMonitor provide convenient real-time monitoring. BIOS/UEFI is useful when you want a software-free baseline, while Linux users can access detailed sensor information through tools such as lm-sensors.
Don’t panic because of a single high reading. Compare idle and loaded temperatures, monitor maximum values, watch for thermal throttling, and check the official thermal specifications for your exact processor.
Once you have those measurements, you’ll know whether the CPU is behaving normally or whether its cooling system deserves a closer look.
