
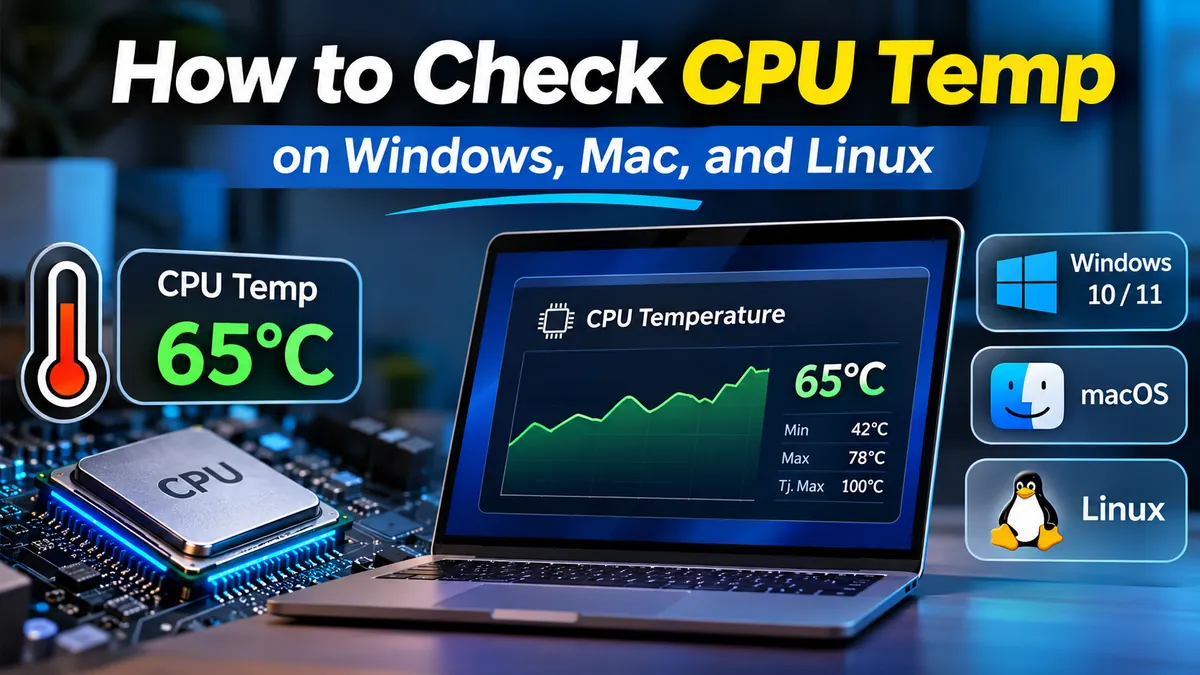

Your computer may feel unusually hot, its fans might run constantly, or games may suddenly start stuttering. These are common reasons to check your processor’s temperature.
Knowing how to check cpu temp helps you identify overheating, investigate performance problems, and understand whether your cooling system is working properly.
To check your CPU temperature, open your computer’s BIOS/UEFI hardware monitor or use a temperature-monitoring application such as Core Temp, HWiNFO, or HWMonitor. On Linux, use the sensors command. Mac users can use compatible third-party monitoring software. Compare readings at idle and under load to assess cooling performance.
The best method depends on your operating system, hardware, and whether you need a quick temperature reading or continuous monitoring.
How to check cpu temp on Windows 11 and Windows 10
Windows 10 and Windows 11 generally do not provide a universal built-in CPU temperature display. Task Manager can show GPU temperature on supported systems, but it does not normally display CPU temperature.
For accurate processor readings, use a hardware-monitoring utility or check your motherboard’s BIOS/UEFI interface.
Method 1: Check CPU temperature using Core Temp
Core Temp is a lightweight Windows application designed to monitor processor temperatures.
It can display individual CPU core readings, processor identification, frequency information, and temperature limits reported by supported hardware.
Follow these steps:
- Visit the official Core Temp website.
- Download and install the application.
- Open Core Temp.
- Locate the temperature readings for your CPU cores.
- Check the minimum and maximum temperatures recorded during the monitoring session.
- Compare the readings while the computer is idle and while running demanding applications.
On supported processors, Core Temp also displays Tj. Max, the processor’s maximum junction temperature reference.
For example, if your CPU has a Tj. Max of 100°C and its current temperature is 65°C, it is operating below that reported limit. This does not mean 100°C is an ideal sustained operating temperature.
Core Temp is useful when you want a straightforward reading without navigating a large collection of system sensors.
Method 2: Use HWiNFO for detailed CPU temperature monitoring
HWiNFO provides more detailed hardware monitoring.
It can report CPU package temperature, individual core temperatures, clock speeds, power consumption, and thermal-throttling indicators when supported.
To check your CPU temperature:
- Download HWiNFO from the official HWiNFO website.
- Launch the application.
- Select Sensors-only mode if offered.
- Find the CPU sensor group.
- Look for entries such as CPU Package, Core Temperatures, CPU (Tctl/Tdie), or CPU Die.
- Review the Current, Minimum, Maximum, and Average columns.
The exact sensor labels depend on your processor and motherboard.
For Intel processors, CPU Package temperature is often a useful overall reading. On many AMD Ryzen systems, CPU (Tctl/Tdie) is a commonly reported control temperature, although available sensors differ by processor generation.
HWiNFO is especially useful for diagnosing overheating because it lets you observe temperature alongside power consumption, clock speeds, and throttling status.
Method 3: Check CPU temperature with HWMonitor
HWMonitor is another popular Windows hardware-monitoring utility.
It provides temperature, voltage, power, and fan-speed readings from supported components.
To use it:
- Download HWMonitor from CPUID’s official website.
- Install or launch the application.
- Expand your processor’s sensor section.
- Locate CPU Package or core temperature readings.
- Observe how the values change when applications open or close.
HWMonitor is a practical option when you want to monitor both CPU temperature and other system components from one interface.
Method 4: Check CPU temperature in BIOS or UEFI
You can check CPU temperature without installing additional software by opening your motherboard’s BIOS or UEFI firmware interface.
This method works on many desktop computers and laptops.
Steps:
- Restart your computer.
- During startup, press the firmware access key, commonly
Delete,F2,F10, orEsc. - Open the Hardware Monitor, PC Health, Monitor, or similar section.
- Locate the CPU Temperature reading.
- Review available fan-speed information.
- Exit without saving changes if you have not modified any settings.
On Windows 11, another way to reach UEFI settings is through:
Settings → System → Recovery → Advanced startup → Restart now
Then choose Troubleshoot → Advanced options → UEFI Firmware Settings, if your system provides that option.
On Windows 10, Advanced startup is generally found under Settings → Update & Security → Recovery.
BIOS temperature readings are useful for basic hardware checks, but they do not represent a true Windows idle temperature or show how hot the processor becomes during gaming.
Firmware interfaces may apply different fan and power-management behavior from the operating system.
How to check cpu temp without installing software
If you prefer not to install an application, your options depend on your computer’s hardware and operating system.
| Method | Windows 10/11 | Requires installation? | Live monitoring under load? |
|---|---|---|---|
| BIOS/UEFI | Usually supported | No | No |
| Windows Task Manager | CPU temperature generally unavailable | No | No |
| Manufacturer’s preinstalled utility | Depends on computer | No, if already installed | Often |
| Core Temp | Supported Windows systems | Usually yes | Yes |
| HWiNFO | Supported Windows systems | Portable option available | Yes |
| HWMonitor | Supported Windows systems | Portable option available | Yes |
Can you check CPU temperature using Command Prompt?
Windows Command Prompt does not provide a reliable universal command for checking CPU temperature.
Some older instructions recommend querying the Windows Management Instrumentation (WMI) thermal-zone interface.
For example:
Get-CimInstance -Namespace root/wmi -ClassName MSAcpi_ThermalZoneTemperatureThis PowerShell command queries ACPI thermal-zone information.
However, the returned data may be unavailable, may represent a motherboard thermal zone rather than the CPU itself, or may not reflect the actual processor temperature.
When a valid reading is provided, the reported value is commonly expressed in tenths of kelvin and can be converted using:
\[ °C = \frac{\text{Temperature}}{10} – 273.15 \]
Because many modern systems do not expose reliable CPU temperature information through this interface, dedicated sensor-monitoring software is preferable.
Can Windows Task Manager show CPU temperature?
Windows Task Manager provides useful CPU performance information, including utilization, speed, processes, and logical processor activity.
To open it:
- Press
Ctrl + Shift + Esc. - Select Performance.
- Click CPU.
You can monitor CPU usage and clock speed, but Task Manager does not ordinarily show processor temperature.
Some systems display GPU temperature under the GPU section. GPU temperature should not be confused with CPU temperature.
How to check CPU temperature on Mac
Mac computers use different monitoring methods depending on whether they contain an Intel processor or Apple silicon.
macOS does not normally provide a CPU temperature reading directly in Activity Monitor.
Check CPU temperature on Intel Macs
Intel-based Macs expose various thermal sensors that compatible third-party applications may be able to read.
Popular options include:
- Macs Fan Control
- iStat Menus
- TG Pro
For example, using Macs Fan Control:
- Download the application from its official website.
- Open the application.
- Locate available CPU-related temperature sensors.
- Review the readings while the Mac is idle.
- Observe temperature changes during demanding tasks.
Available sensors vary between Mac models.
Avoid changing fan-control settings unless you understand the consequences. Monitoring temperature does not require manually overriding the cooling system.
Check temperature on Apple silicon Macs
Apple silicon processors, including Apple’s M-series chips, combine CPU, GPU, and other components within a system-on-chip design.
This means temperature monitoring differs from traditional Intel-based Macs.
Some third-party utilities can display available thermal sensors, but compatibility and the specific temperature values shown depend on the Mac model, chip generation, and macOS version.
Apple silicon systems may also expose thermal-pressure information rather than a single conventional CPU package temperature.
For a built-in command-line indication of thermal conditions, you can run:
sudo powermetrics --samplers thermal -n 1This command may report thermal-pressure or thermal-state information on supported macOS systems. It does not guarantee a numerical CPU temperature reading.
You may need administrator authorization, and the available output varies by hardware and operating-system version.
How to tell whether your Mac is overheating
Watch for symptoms such as reduced performance during sustained workloads, unusually high chassis temperatures, unexpected shutdowns, or persistent fan activity on models equipped with fans.
Fanless MacBook Air models do not have internal cooling fans, so the absence of fan noise does not indicate that the processor is running cool.
macOS automatically manages processor performance and thermal conditions to protect the hardware.
If your Mac repeatedly slows down under sustained workloads, inspect its ventilation, ambient temperature, background activity, and thermal monitoring information.
How to check CPU temperature on Linux
Linux provides several ways to monitor processor temperature, including command-line utilities and graphical applications.
The most common approach uses the lm-sensors package.
Method 1: Use the sensors command
On Ubuntu or Debian-based distributions, install the package with:
sudo apt update
sudo apt install lm-sensors
Then run:
sensorsDepending on your hardware, the output may resemble:
coretemp-isa-0000
Package id 0:  +48.0°C
Core 0:        +45.0°C
Core 1:        +47.0°C
These numbers are illustrative, not universal readings.
For continuous monitoring, use:
watch -n 2 sensorsThis refreshes the displayed sensor values every two seconds.
Some hardware requires additional sensor configuration or kernel driver support. If sensors are missing, sudo sensors-detect may help identify supported monitoring chips, although it should be used with care and is not necessary on every system.
Method 2: Check CPU thermal zones
Linux also exposes thermal information through the sysfs interface.
On supported systems, you can inspect:
cat /sys/class/thermal/thermal_zone*/tempMany thermal-zone readings are expressed in millidegrees Celsius.
For example:
48000This corresponds to 48°C.
However, thermal zones can represent different components. Not every thermal-zone entry corresponds to the CPU.
To identify each zone, inspect its type:
cat /sys/class/thermal/thermal_zone*/typeThis helps distinguish processor-related sensors from other thermal devices.
Method 3: Use a graphical Linux temperature monitor
If you prefer a visual interface, Psensor is an option on supported Linux desktop environments.
On Ubuntu or Debian:
sudo apt install psensorLaunch Psensor and select the available CPU temperature sensors.
It can display temperature trends over time and may support alerts, depending on the configuration and hardware.
For servers, the sensors command is usually more practical because it works without a graphical desktop.
What is a normal CPU temperature?
A normal CPU temperature depends on the processor model, cooling system, room temperature, and current workload.
A desktop CPU with a large air cooler may operate significantly cooler than a thin laptop processor performing the same task.
The following ranges are general reference points, not universal manufacturer specifications.
| CPU temperature | Typical interpretation |
|---|---|
| 30–45°C | Common for a well-cooled desktop at idle |
| 45–60°C | Normal for many systems during light activity |
| 60–75°C | Common during moderate workloads |
| 75–85°C | Often expected during gaming or intensive work |
| 85–95°C | High; may be normal for some modern processors |
| 95–105°C | Near or beyond the thermal limit of some CPUs; check specifications |
A processor operating at 90°C is not automatically overheating. Some modern CPUs are designed to approach their maximum operating temperature under sustained workloads.
Intel explains that temperature limits vary by processor and that its processors use thermal-control mechanisms to manage excessive heat. Intel+1
What is a safe CPU temperature while gaming?
Gaming places a varying load on the processor. CPU temperature can rise when loading a new level, compiling shaders, processing physics, or running games with high frame rates.
For many gaming desktops, temperatures between approximately 60°C and 85°C are common.
Gaming laptops may run hotter because they have smaller cooling systems and share limited thermal capacity between the CPU and GPU.
To determine whether your gaming temperature is acceptable, check your processor’s official thermal specifications and monitor for sustained thermal throttling.
Is 90°C too hot for a CPU?
A sustained temperature of 90°C deserves attention, but it is not automatically unsafe.
For some processors, 90°C is within the manufacturer’s designed operating range. For others, it may be close to the maximum recommended temperature.
For Intel CPUs, you can find the processor’s temperature specification through Intel’s product information. For AMD Ryzen CPUs, consult AMD’s processor specifications.
The critical information is the model-specific maximum operating temperature, often labeled Tjmax or Tjunction.
AMD also notes that CPU temperature is influenced by workload, cooler performance, airflow, ambient conditions, and power settings. AMD+1
How to monitor CPU temperature while gaming or under load
A single temperature reading does not always reveal a cooling problem.
A computer might remain at 40°C while idle but approach its thermal limit after ten minutes of gaming.
Monitoring the processor during a realistic workload provides more useful information.
Monitor temperature with an in-game overlay
Tools such as MSI Afterburner and RivaTuner Statistics Server can display performance statistics while a game is running.
Depending on hardware compatibility and configuration, an overlay may show CPU temperature, CPU usage, GPU temperature, frame rate, and frame time.
A typical setup involves:
- Installing MSI Afterburner and the compatible RivaTuner Statistics Server component.
- Opening MSI Afterburner’s settings.
- Selecting the Monitoring tab.
- Finding an available CPU temperature sensor.
- Enabling its on-screen display option.
- Starting a game and observing temperature changes.
Some configurations may require another monitoring utility to expose the desired CPU sensor.
Check CPU temperature during a stress test
A CPU stress test creates a sustained workload to evaluate processor stability and cooling performance.
Common testing applications include Cinebench, OCCT, and Prime95.
A controlled testing process is:
- Open HWiNFO and reset its minimum and maximum sensor values.
- Record the initial CPU package temperature.
- Start a moderate CPU benchmark.
- Observe temperature, power consumption, and processor clock speeds.
- Stop the test if temperatures exceed the manufacturer’s limits, severe throttling occurs, or the system becomes unstable.
- Review the highest temperature recorded.
Avoid running aggressive stress tests on a computer already showing overheating symptoms.
Also remember that synthetic stress tests can generate substantially more heat than ordinary applications.
CPU temperature versus CPU usage
CPU usage measures how much processing capacity is being used. Temperature measures thermal conditions.
They are related but not interchangeable.
A CPU running at 30% utilization can sometimes become hotter than expected because of high boost frequencies, power consumption, poor cooling, or background activity.
Similarly, a well-cooled CPU may maintain a relatively moderate temperature even at high utilization.
For accurate troubleshooting, observe temperature, CPU power, clock speed, and workload together.
How to read CPU temperature sensors correctly
Temperature-monitoring applications may show several values for the same processor.
These readings can differ because they represent different sensor locations or calculation methods.
| Sensor label | What it generally represents |
|---|---|
| CPU Package | Overall processor package-related temperature |
| Core Temperature | Temperature reported for an individual CPU core |
| Core Max | Highest core temperature among monitored cores |
| CPU Die | Processor die-related thermal measurement |
| CPU (Tctl/Tdie) | AMD temperature control or die reading, depending on model |
| CPU Socket | Motherboard sensor near or beneath the processor |
| Tjmax | Processor’s specified maximum junction temperature |
Why are CPU core temperatures different?
Modern processors contain multiple cores, and not all cores perform the same amount of work.
One core may be processing a demanding task while another is relatively idle.
Differences in physical location, boost behavior, sensor calibration, and thermal distribution can also affect readings.
Small differences between cores are generally normal.
Should you monitor CPU package or core temperature?
For general system monitoring, CPU package or an appropriate die/control temperature is often a useful starting point.
For detailed troubleshooting, examine the hottest core alongside the package reading.
If a processor reaches its thermal limit, check whether the monitoring application reports thermal throttling.
Do not compare unrelated sensor values as though they were identical measurements.
Why do two CPU monitoring programs show different temperatures?
Different applications may read different sensors, update at different intervals, or interpret hardware data differently.
For example, one program might show the highest core temperature while another displays a motherboard socket sensor.
To make a meaningful comparison, identify the exact sensor label in each application.
How to lower CPU temperature if it is too high
If monitoring reveals excessive temperatures, begin with simple troubleshooting before considering hardware changes.
1. Check for excessive CPU usage
Open Task Manager on Windows or Activity Monitor on macOS.
Look for applications consuming unusually high CPU resources.
Browsers with many active tabs, background updates, antivirus scans, and demanding applications can increase processor temperatures.
Close unnecessary applications and check whether temperatures decrease.
2. Improve airflow
Restricted airflow can trap warm air inside a desktop case or laptop chassis.
Make sure ventilation openings are unobstructed.
For desktop computers, inspect intake and exhaust fans. Ensure the case has adequate clearance from walls and other objects.
For laptops, use a firm, flat surface rather than a blanket or cushion that may block ventilation.
3. Remove dust from the cooling system
Dust accumulation can reduce cooling efficiency.
Before cleaning a computer:
- Shut it down and disconnect external power.
- Follow the manufacturer’s maintenance instructions.
- Use appropriate cleaning tools.
- Avoid forcing fans to spin rapidly with compressed air.
- Do not open a laptop or remove components if doing so would be unsafe or beyond your experience.
Dust removal can improve cooling when airflow has been obstructed.
4. Check CPU fan or pump operation
A malfunctioning CPU fan or liquid-cooling pump can cause rapid temperature increases.
On supported systems, check fan speeds using BIOS/UEFI or a hardware-monitoring utility.
If a CPU cooler fan is not spinning when it should, investigate the fan connection and control settings.
For liquid cooling, check the pump’s reported operation and inspect for unusual noises or signs of leakage.
Do not continue demanding workloads if you suspect the cooling system has failed.
5. Inspect thermal paste and cooler mounting
Thermal paste helps transfer heat between the processor and its cooler.
Poor cooler contact, incorrect mounting pressure, or degraded thermal interface material can contribute to elevated temperatures.
However, replacing thermal paste is not automatically necessary whenever a CPU runs hot.
First rule out dust, high ambient temperatures, excessive workloads, and incorrect fan operation.
If the cooler needs to be removed, follow the manufacturer’s installation procedure and use a compatible thermal interface material.
6. Review overclocking and power settings
Overclocking can increase processor power consumption and heat generation.
If your computer is overheating after changing CPU settings, return to manufacturer-supported defaults and reassess temperatures.
Power limits, voltage adjustments, and aggressive performance profiles can also influence heat output.
Changes to voltage or firmware settings should be approached carefully because incorrect configurations can cause instability.
7. Consider room temperature
Ambient temperature affects the cooling system’s ability to remove heat.
A computer operating in a 35°C room may run noticeably hotter than the same system in a 22°C room.
When comparing temperature readings, consider the room environment as well as the workload.
Why is CPU temperature high when the computer is idle?
An unusually high idle temperature can have several explanations.
The computer may not actually be idle. Background processes, software updates, indexing, or security scans may be using the CPU.
Modern processors also change clock speeds rapidly, which can create short temperature spikes even during light activity.
Other possible causes include insufficient airflow, an improperly mounted cooler, a malfunctioning fan, high ambient temperature, or incorrect sensor interpretation.
How to troubleshoot high idle temperature
Start by allowing the computer to settle for several minutes after startup.
Then check CPU utilization and temperature simultaneously.
If utilization remains high, identify the responsible process.
If utilization is low but temperatures remain unusually elevated, inspect cooling operation and compare the readings with the manufacturer’s processor specifications.
For example, a desktop CPU sitting at 85°C with minimal activity warrants investigation, especially if its fans are operating at high speed.
However, the appropriate response depends on the processor and system design.
What to do if CPU temperature readings are missing or incorrect
Sometimes monitoring applications display no temperature, an implausible number, or readings that never change.
This does not necessarily mean the processor is damaged.
CPU temperature not showing in monitoring software
Possible explanations include unsupported hardware, outdated monitoring software, unavailable firmware sensor data, or limited application permissions.
Try updating the monitoring utility and checking whether another reputable application can detect the processor sensors.
On laptops, some sensor information may be restricted by the manufacturer.
CPU temperature stuck at one value
A temperature that never changes may represent a static firmware value, an incorrectly identified sensor, or a monitoring problem.
Compare it with a recognized processor package or core temperature sensor.
Restart the monitoring application and check whether its readings respond to ordinary workload changes.
CPU temperature suddenly spikes
Brief temperature spikes can occur when the processor boosts its clock speed to complete a task quickly.
A short increase is not necessarily dangerous.
Pay closer attention to sustained temperatures, performance reductions, and whether the processor repeatedly reaches its thermal limit.
What happens when a CPU overheats?
Modern processors typically contain built-in thermal protection mechanisms.
When the processor approaches its specified thermal limit, it may reduce clock speed or power consumption. This is known as thermal throttling.
If temperatures cannot be controlled, the system may shut down to protect the hardware.
Intel documents both thermal throttling and automatic shutdown as processor protection mechanisms. Intel
Repeated unexpected shutdowns, severe performance degradation, or persistent overheating should be investigated promptly.
How often should you check CPU temperature?
Most users do not need to monitor processor temperature continuously.
Checking occasionally is useful, especially after installing new hardware, changing cooling settings, or noticing unusual performance.
For gaming PCs, monitoring during a demanding session can establish a useful baseline.
For laptops, temperature checks can help investigate excessive fan noise, heat, or sustained performance reductions.
For workstations and servers, ongoing thermal monitoring may be appropriate because long-running workloads and uptime requirements make early detection more valuable.
The most useful practice is to understand your system’s normal behavior so you can recognize meaningful changes.
Final thoughts on how to check cpu temp
Learning how to check cpu temp is a straightforward way to understand your computer’s cooling performance and identify potential overheating problems.
On Windows, Core Temp, HWiNFO, and HWMonitor provide practical live readings. BIOS/UEFI offers a useful option without additional software. Linux users can monitor supported sensors with lm-sensors, while Mac users can rely on compatible monitoring utilities and available thermal-state information.
Remember that a temperature reading only becomes meaningful when considered alongside your processor model, workload, cooling system, and manufacturer specifications.
Start by measuring the CPU temperature at idle, compare it with a normal demanding workload, and check for sustained throttling or instability before deciding whether cooling improvements are necessary.
